

Client review links
A client review link has several views but only one download. That is not strange. The recipient can return to the share page more than once and still save only one copy.
You send a file, move on to something else, then come back later wondering whether the link was opened at all. That question gets harder once several files are being shared at the same time or one large video starts using much more bandwidth than expected.
Media2URL Insights brings the useful numbers into one place. You can check views on active share links, recent downloads, delivered bandwidth and the current workspace usage without turning file sharing into a full visitor tracking setup.
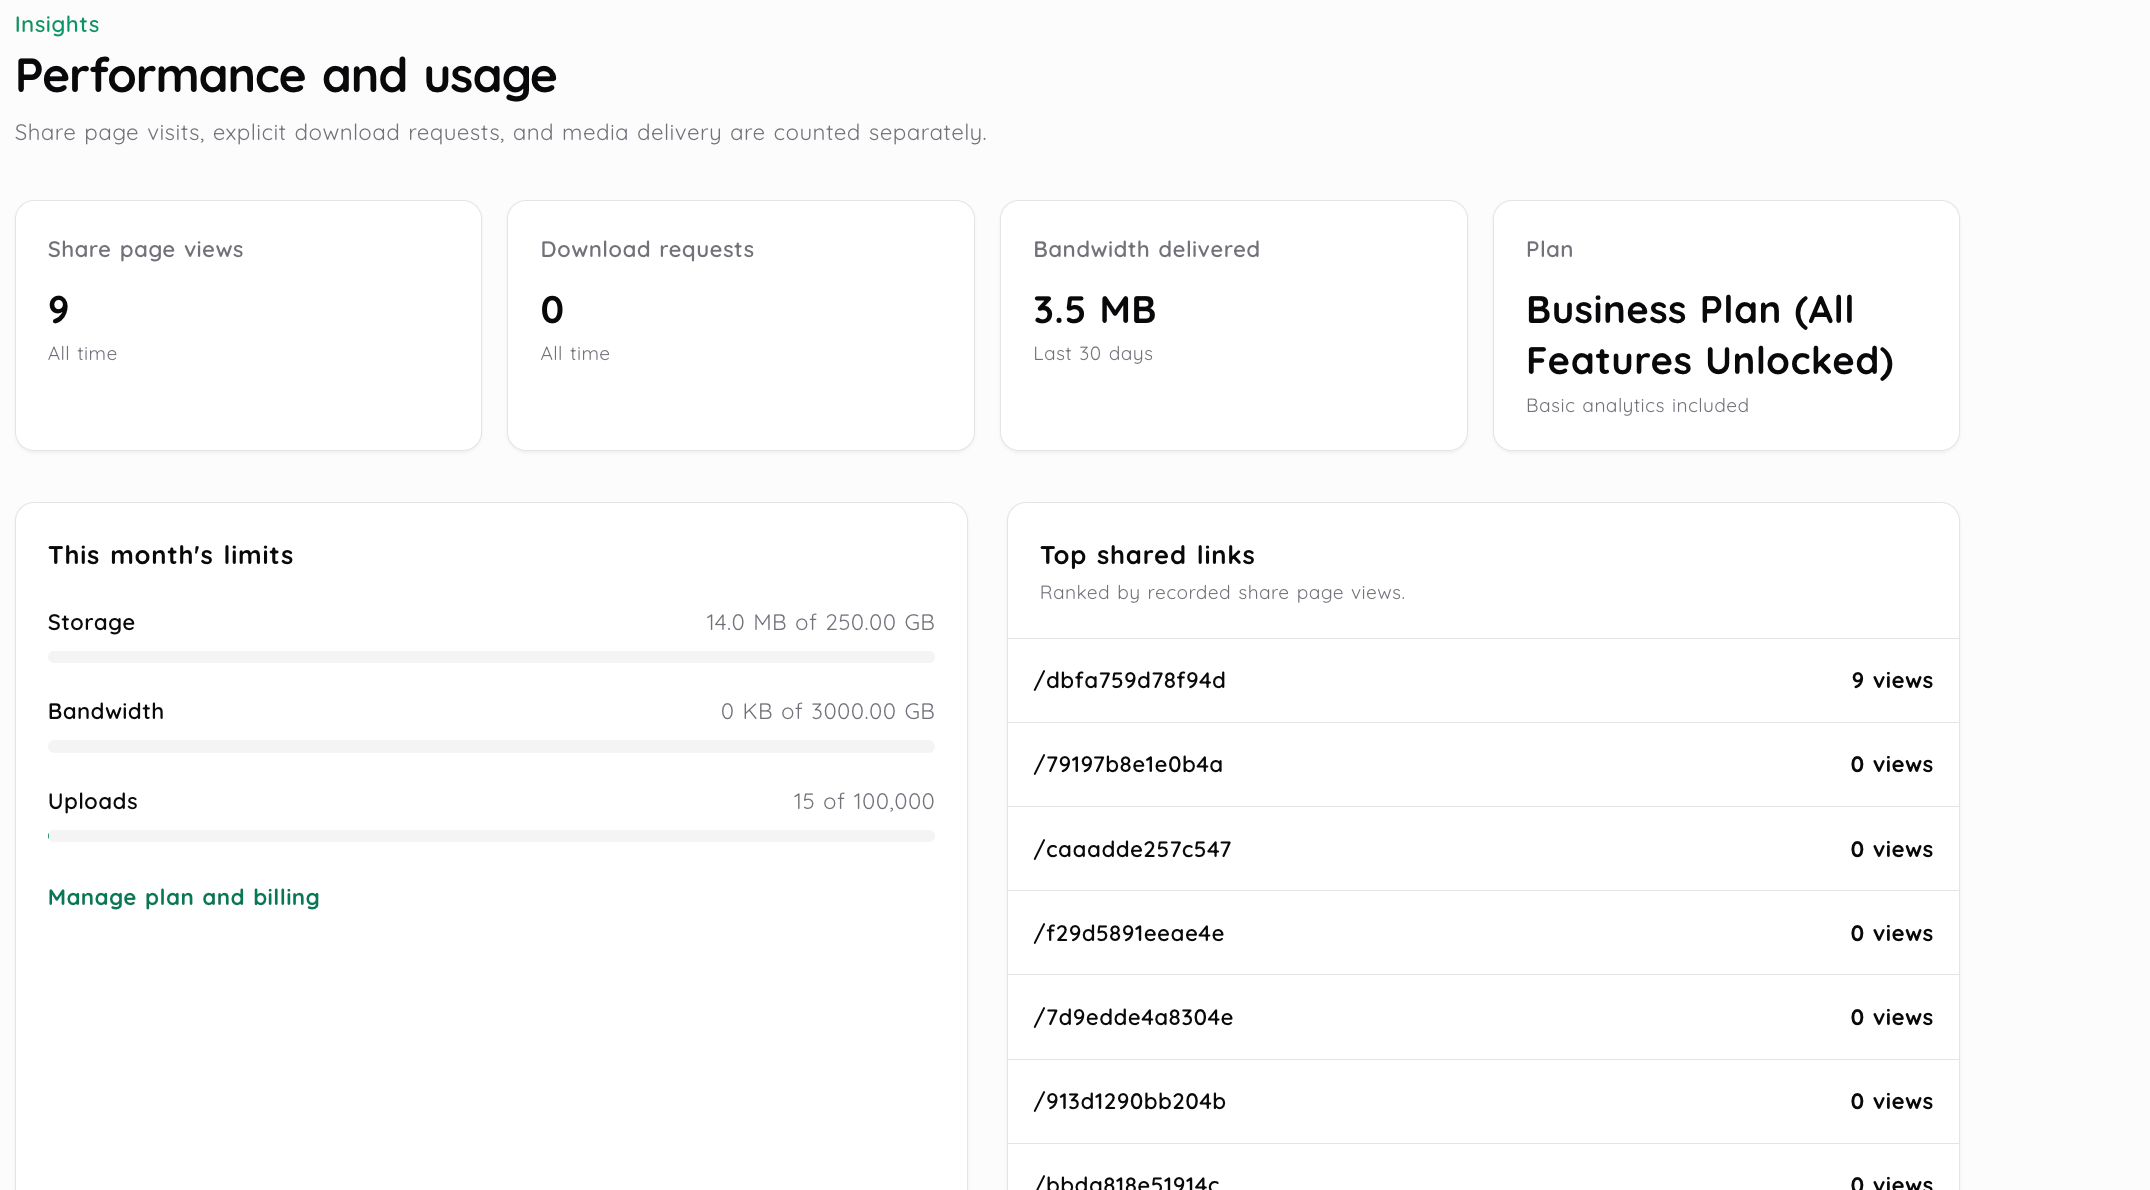
The numbers become much easier to read when you stop treating them as one big performance score.
If you want to know whether a share page received activity, look at views. If you want to know whether people downloaded a supported file, look at downloads. If the concern is data transfer, bandwidth is the useful number.
Workspace usage is different again. Storage and plan meters tell you about the account itself, not whether a recipient liked or understood the file.
| Metric | What it shows |
|---|---|
| Share page views | The accumulated view count recorded for an active share link |
| 30 day downloads | Supported download events recorded over the rolling 30 day period |
| 30 day bandwidth | File data delivered over the rolling 30 day period |
| Storage usage | How much workspace storage is currently being used |
| Monthly bandwidth quota | Current bandwidth usage compared with the plan limit |
| Monthly upload quota | Uploads counted against the available monthly limit |
| Top Shared Links | Up to 10 share links ordered by recorded view count |
A small image can collect plenty of views and barely move the bandwidth meter. A large video can do the opposite after only a few requests. The numbers make more sense when you read them together instead of asking one metric to explain everything.
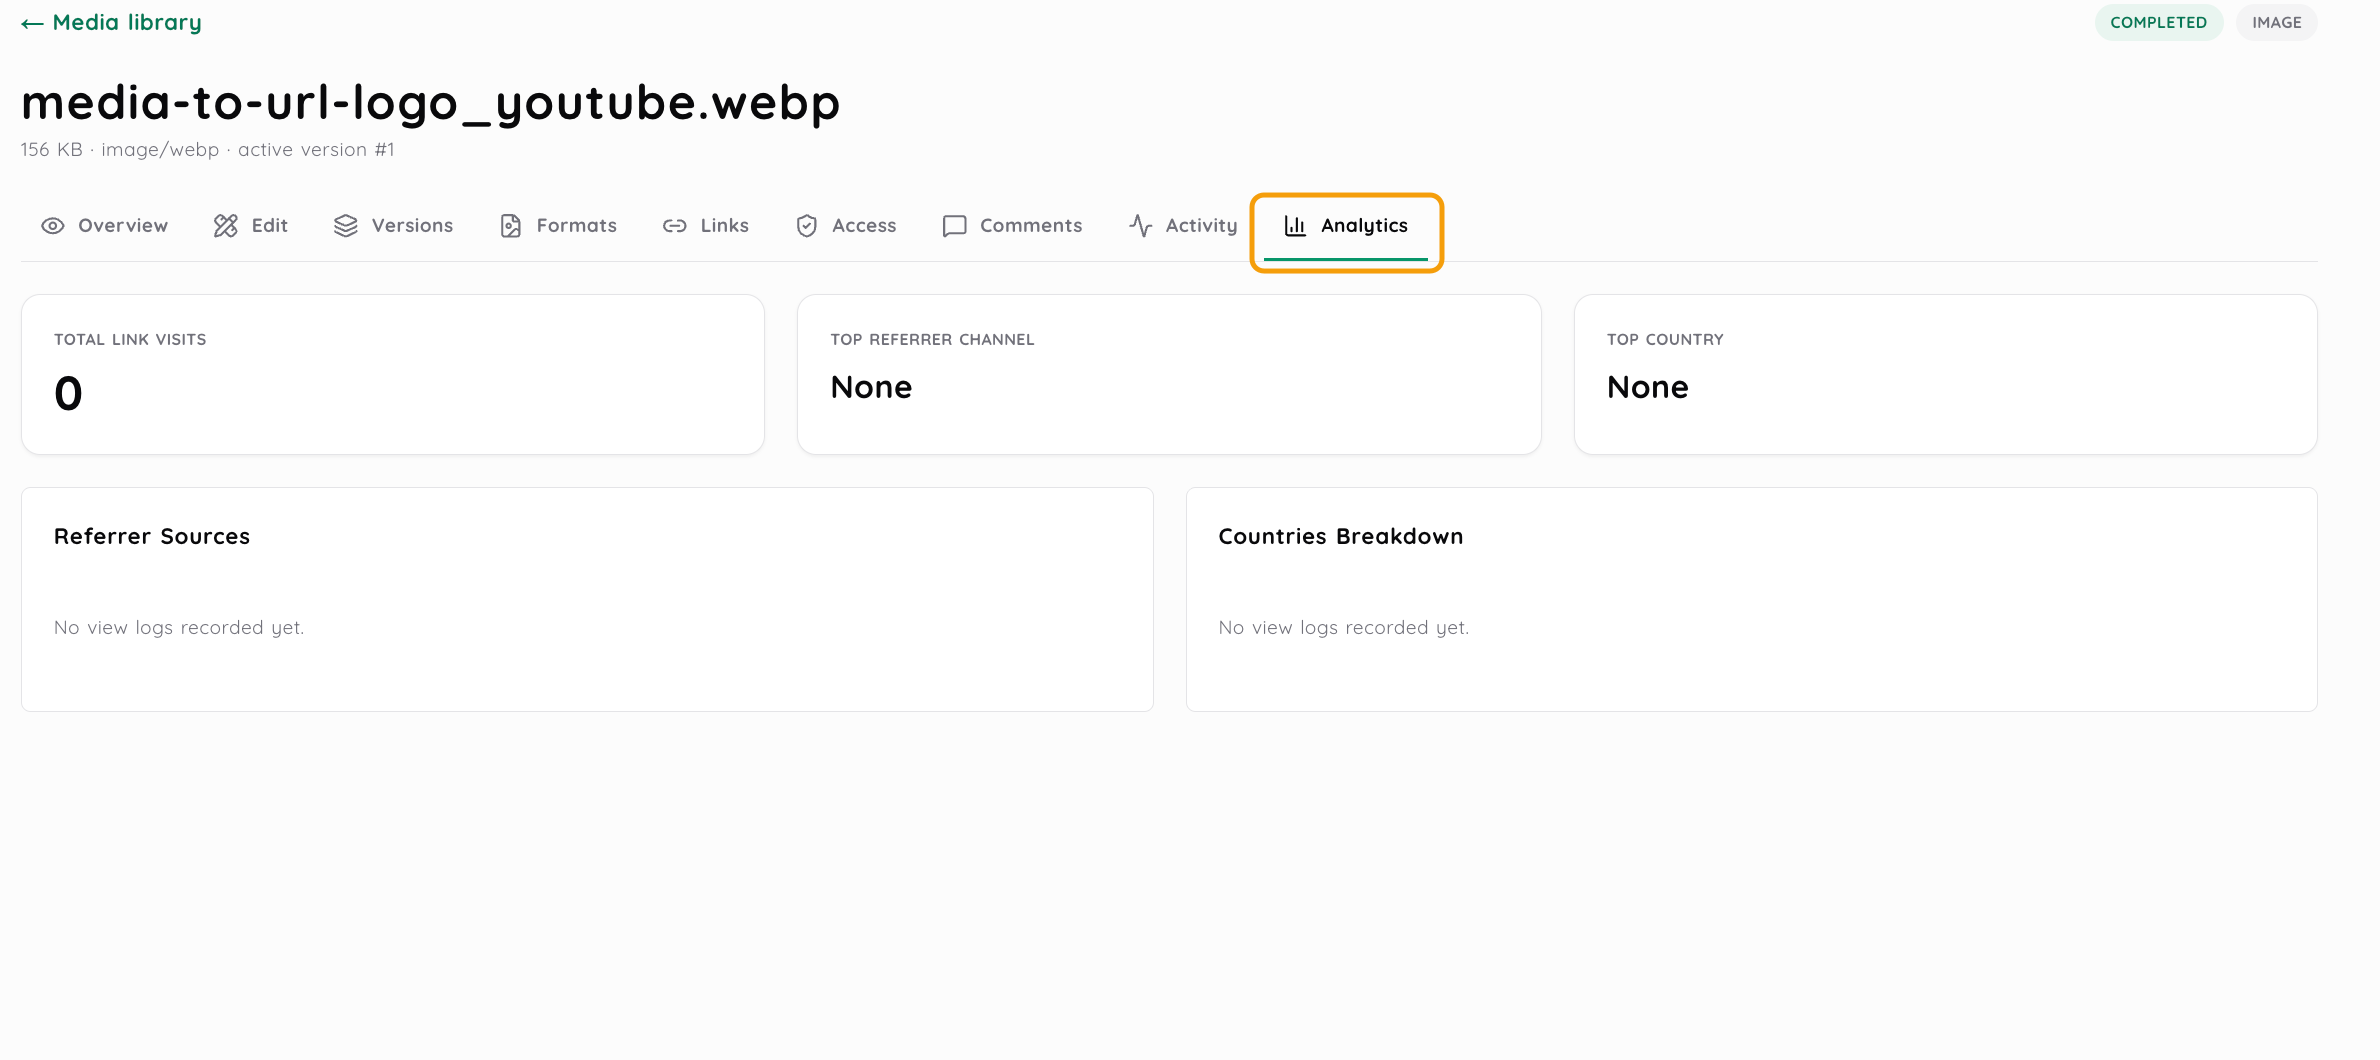
Each media asset has its own Analytics tab with visit totals and referrer or country summaries when view records are available. This capture shows the empty state before any view logs have been recorded.
Suppose you send a PDF to a client. They open the share page twice during the week, then download the file once.
The view count and download count will not match because they are recording different actions. That is expected.
Views are useful when you simply want to know whether the share page is getting opened. Downloads go a step further and show supported download activity, but they still do not tell you what happened after the file reached the recipient's device.
The dashboard cannot tell whether somebody read every page of the PDF or ignored it after opening. It records the activity around the link, not the person's attention.
A view is a count. Bandwidth is data.
If a large video is delivered several times, it can use more bandwidth than hundreds of views on a small image. That is why a rising bandwidth figure does not automatically mean one link has become much more popular.
Media2URL adds up the recorded bytes delivered during the rolling 30 day period and shows the total in readable units such as KB, MB or GB.
This becomes useful when usage increases and the view count does not seem high enough to explain it. A few large files can move the bandwidth total quickly.
When a workspace has many active assets, checking them one by one becomes tedious.
Top Shared Links shows up to 10 links ranked by their recorded view totals. You can use that list to spot the share pages receiving the most views, then return to the related asset if the file or its settings need attention.
The ranking is based on views only. It is not a combined score built from downloads, bandwidth or anything else. That distinction is useful because a file at the top of the list is not automatically the biggest bandwidth user.
Insights is not limited to what recipients do with individual links.
Storage usage shows how much space the current library is occupying. The monthly bandwidth meter shows how much delivery has been counted against the plan allowance, while the upload meter shows the uploads counted during the current period.
These figures are useful before something larger happens. If you are about to upload a big collection or share a media file with a much wider audience, checking the workspace first gives you a better idea of where the account currently stands.
Storage should be read differently from monthly activity. It reflects what is sitting in the workspace now, while bandwidth and upload usage follow the current plan period.
The dashboard stays focused on aggregate file activity.
Media2URL does not currently show referrer reports, visitor country or browser breakdowns inside Insights. You cannot use this page to find out which country produced the most views, where the visitor came from or which browser they used.
That makes the feature narrower than a full website analytics service, but it also keeps the numbers centred on file delivery and account usage.
If your question is “Did this link get opened?” Insights can help. If your question is “Who was the visitor and exactly how did they reach the page?” the current dashboard does not provide that level of tracking.
Historical activity is tied to active links.
If an asset is deleted or the link records are cleared, the historical engagement tracking associated with that URL is reset. Keep that in mind before removing something when the previous activity is still useful to you.
The analytics are therefore part of the life of that link rather than a separate permanent reporting archive.
A client review link has several views but only one download. That is not strange. The recipient can return to the share page more than once and still save only one copy.
A video shows modest views but bandwidth is climbing quickly. The size of the file can explain that without any dramatic increase in traffic.
Another image sits near the top of Top Shared Links while barely affecting bandwidth. That can also be completely normal because many people can open a lightweight file without transferring much data.
The useful habit is to ask what each number is measuring before deciding what it means.
No. Insights shows aggregate activity rather than the identity of individual visitors. You can see recorded share page views, supported download events and delivered bandwidth. Referrer, country and browser details are not included in the current dashboard.
The current feature information does not state a fixed refresh interval. Use the figures shown in the dashboard as the current recorded data available for the workspace rather than assuming a specific update schedule.
The current Insights page shows the rolling 30 day bandwidth total and Top Shared Links ranked by views. It does not describe a separate list that ranks individual files by bandwidth, so the Top Shared Links table should not be read that way.
Insights shows the current monthly bandwidth usage against the allowance provided by the plan. The current feature information does not specify the exact account behaviour after the limit is reached. Check the active plan details and workspace controls for the current handling of that quota.
A view records activity on the share page. A download records a supported download event. Someone can open the page without downloading the file, so the two totals are not expected to match.
No. File size tells you how large one stored asset is. Bandwidth records the amount of file data delivered through usage. The same file can contribute to bandwidth again each time it is delivered.
The dashboard orders up to 10 share links using their recorded view totals. Downloads and bandwidth are not combined into that ranking.
No. Country and browser breakdowns are not part of the current Insights dashboard, and referrer reporting is not included either. Insights stays focused on aggregate link activity, file delivery and workspace usage.
Next steps
When you need to find or manage the asset behind a high view link.
When a large file needs another processing step before continued sharing.
For understanding who should be able to reach the file.
When the quota meters need to be compared with current plan limits.